
User:Unbuttered Parsnip/sandbox
- Ubay
Barangays
| District I | District II | District III | District IV |
| District V | District VI | District VII | District VIII |
Ubay comprises 44 barangays organized into eight districts.
Below is the list of barangays, together with population, land area, population density, district, and date of their barrio fiesta.
| Barangay | Population (2007)[1] |
Population (2010)[2] |
±% p.a. | Land Area[3] |
Pop. density |
District | Date of Fiesta |
|---|---|---|---|---|---|---|---|
| Achila | 1,246 | 1,276 | 0.80% | 3.84 km2 1.48 sq mi |
332/km2 860/sq mi |
IV | January 15 |
| Bay-ang | 1,626 | 1,656 | 0.61% | 6.32 km2 2.44 sq mi |
262/km2 680/sq mi |
III | May 21 |
| Benliw | 2,006 | 2,223 | 3.48% | 5.89 km2 2.27 sq mi |
377/km2 980/sq mi |
VII | May 13 |
| Biabas | 2,207 | 2,573 | 5.25% | 22.00 km2 8.49 sq mi |
117/km2 300/sq mi |
VIII | May 17 |
| Bongbong | 779 | 807 | 1.18% | 1.61 km2 0.62 sq mi |
501/km2 1,300/sq mi |
II | December 8 |
| Bood | 2,397 | 2,717 | 4.27% | 1.52 km2 0.59 sq mi |
1,788/km2 4,630/sq mi |
V | January 16 |
| Buenavista | 711 | 688 | −1.09% | 6.51 km2 2.51 sq mi |
106/km2 270/sq mi |
I | Last Saturday of April |
| Bulilis | 1,705 | 1,711 | 0.12% | 7.40 km2 2.86 sq mi |
231/km2 600/sq mi |
II | December 8 |
| Cagting | 1,853 | 1,597 | −4.84% | 10.44 km2 4.03 sq mi |
153/km2 400/sq mi |
VII | January 24 |
| Calanggaman | 1,590 | 1,623 | 0.69% | 6.18 km2 2.39 sq mi |
263/km2 680/sq mi |
III | December 8 |
| California | 713 | 801 | 3.96% | 3.19 km2 1.23 sq mi |
251/km2 650/sq mi |
II | May 13 |
| Camali-an | 528 | 581 | 3.24% | 5.32 km2 2.05 sq mi |
109/km2 280/sq mi |
III | November 26 |
| Camambugan | 2,048 | 2,251 | 3.20% | 5.47 km2 2.11 sq mi |
412/km2 1,070/sq mi |
IV | May 15 |
| Casate | 2,710 | 2,512 | −2.50% | 4.60 km2 1.78 sq mi |
546/km2 1,410/sq mi |
IV | April 5 |
| Cuya | 469 | 516 | 3.23% | 0.66 km2 0.25 sq mi |
782/km2 2,030/sq mi |
VIII | February 6 |
| Fatima | 3,056 | 3,235 | 1.92% | 0.75 km2 0.29 sq mi |
4,313/km2 11,170/sq mi |
V | May 13 |
| Gabi | 1,303 | 1,378 | 1.88% | 16.46 km2 6.36 sq mi |
84/km2 220/sq mi |
II | December 9 |
| Governor Boyles | 784 | 888 | 4.24% | 8.24 km2 3.18 sq mi |
108/km2 280/sq mi |
I | May 15 |
| Guintabo-an | 625 | 686 | 3.15% | 0.66 km2 0.25 sq mi |
1,039/km2 2,690/sq mi |
VII | January 15 |
| Hambabauran | 962 | 1,106 | 4.76% | 5.21 km2 2.01 sq mi |
212/km2 550/sq mi |
III | January 15 |
| Humayhumay | 1,765 | 1,708 | −1.09% | 8.15 km2 3.15 sq mi |
210/km2 540/sq mi |
IV | February 14 |
| Ilihan | 843 | 802 | −1.65% | 16.83 km2 6.50 sq mi |
48/km2 120/sq mi |
I | May 15 |
| Imelda | 1,895 | 1,761 | −2.41% | 6.57 km2 2.54 sq mi |
268/km2 690/sq mi |
VII | May 8 & Nov. 27 |
| Juagdan | 1,106 | 1,121 | 0.45% | 1.31 km2 0.51 sq mi |
856/km2 2,220/sq mi |
VIII | May 23 |
| Katarungan | 1,294 | 1,524 | 5.60% | 4.09 km2 1.58 sq mi |
373/km2 970/sq mi |
V | May 30 |
| Lomangog | 2,033 | 2,025 | −0.13% | 6.42 km2 2.48 sq mi |
315/km2 820/sq mi |
II | January 15 |
| Los Angeles | 397 | 436 | 3.17% | 2.74 km2 1.06 sq mi |
159/km2 410/sq mi |
II | April 27 |
| Pag-asa | 1,081 | 1,168 | 2.61% | 3.78 km2 1.46 sq mi |
309/km2 800/sq mi |
III | December 8 |
| Pangpang | 1,038 | 1,220 | 5.53% | 4.50 km2 1.74 sq mi |
271/km2 700/sq mi |
IV | December 15 |
| Poblacion | 3,698 | 3,633 | −0.59% | 1.99 km2 0.77 sq mi |
1,826/km2 4,730/sq mi |
V | Last Friday of January |
| San Francisco | 1,497 | 1,677 | 3.86% | 11.07 km2 4.27 sq mi |
151/km2 390/sq mi |
I | June 26 |
| San Isidro | 583 | 707 | 6.64% | 2.62 km2 1.01 sq mi |
270/km2 700/sq mi |
VI | May 21 |
| San Pascual | 3,088 | 3,127 | 0.42% | 9.73 km2 3.76 sq mi |
321/km2 830/sq mi |
I | Last Saturday of April |
| San Vicente | 962 | 1,074 | 3.74% | 49.66 km2 19.17 sq mi |
22/km2 57/sq mi |
VIII | April 5 |
| Sentinela | 936 | 969 | 1.16% | 2.71 km2 1.05 sq mi |
358/km2 930/sq mi |
VI | May 29 |
| Sinandigan | 1,923 | 1,874 | −0.86% | 6.07 km2 2.34 sq mi |
309/km2 800/sq mi |
VII | December 8 |
| Tapal | 1,212 | 1,371 | 4.19% | 2.90 km2 1.12 sq mi |
473/km2 1,230/sq mi |
VI | May 3 |
| Tapon | 2,514 | 2,481 | −0.44% | 1.53 km2 0.59 sq mi |
1,622/km2 4,200/sq mi |
V | June 29 |
| Tintinan | 580 | 623 | 2.41% | 0.31 km2 0.12 sq mi |
2,010/km2 5,200/sq mi |
VIII | September 29 |
| Tipolo | 2,208 | 2,456 | 3.61% | 6.55 km2 2.53 sq mi |
375/km2 970/sq mi |
VI | April 5 |
| Tubog | 868 | 885 | 0.65% | 5.14 km2 1.98 sq mi |
172/km2 450/sq mi |
III | May 16 |
| Tuboran | 1,135 | 1,372 | 6.53% | 5.47 km2 2.11 sq mi |
251/km2 650/sq mi |
IV | January 15 |
| Union | 2,412 | 2,332 | −1.12% | 5.14 km2 1.98 sq mi |
454/km2 1,180/sq mi |
VI | January 15 |
| Villa Teresita | 1,514 | 1,407 | −2.41% | 12.62 km2 4.87 sq mi |
111/km2 290/sq mi |
I | November 28 |
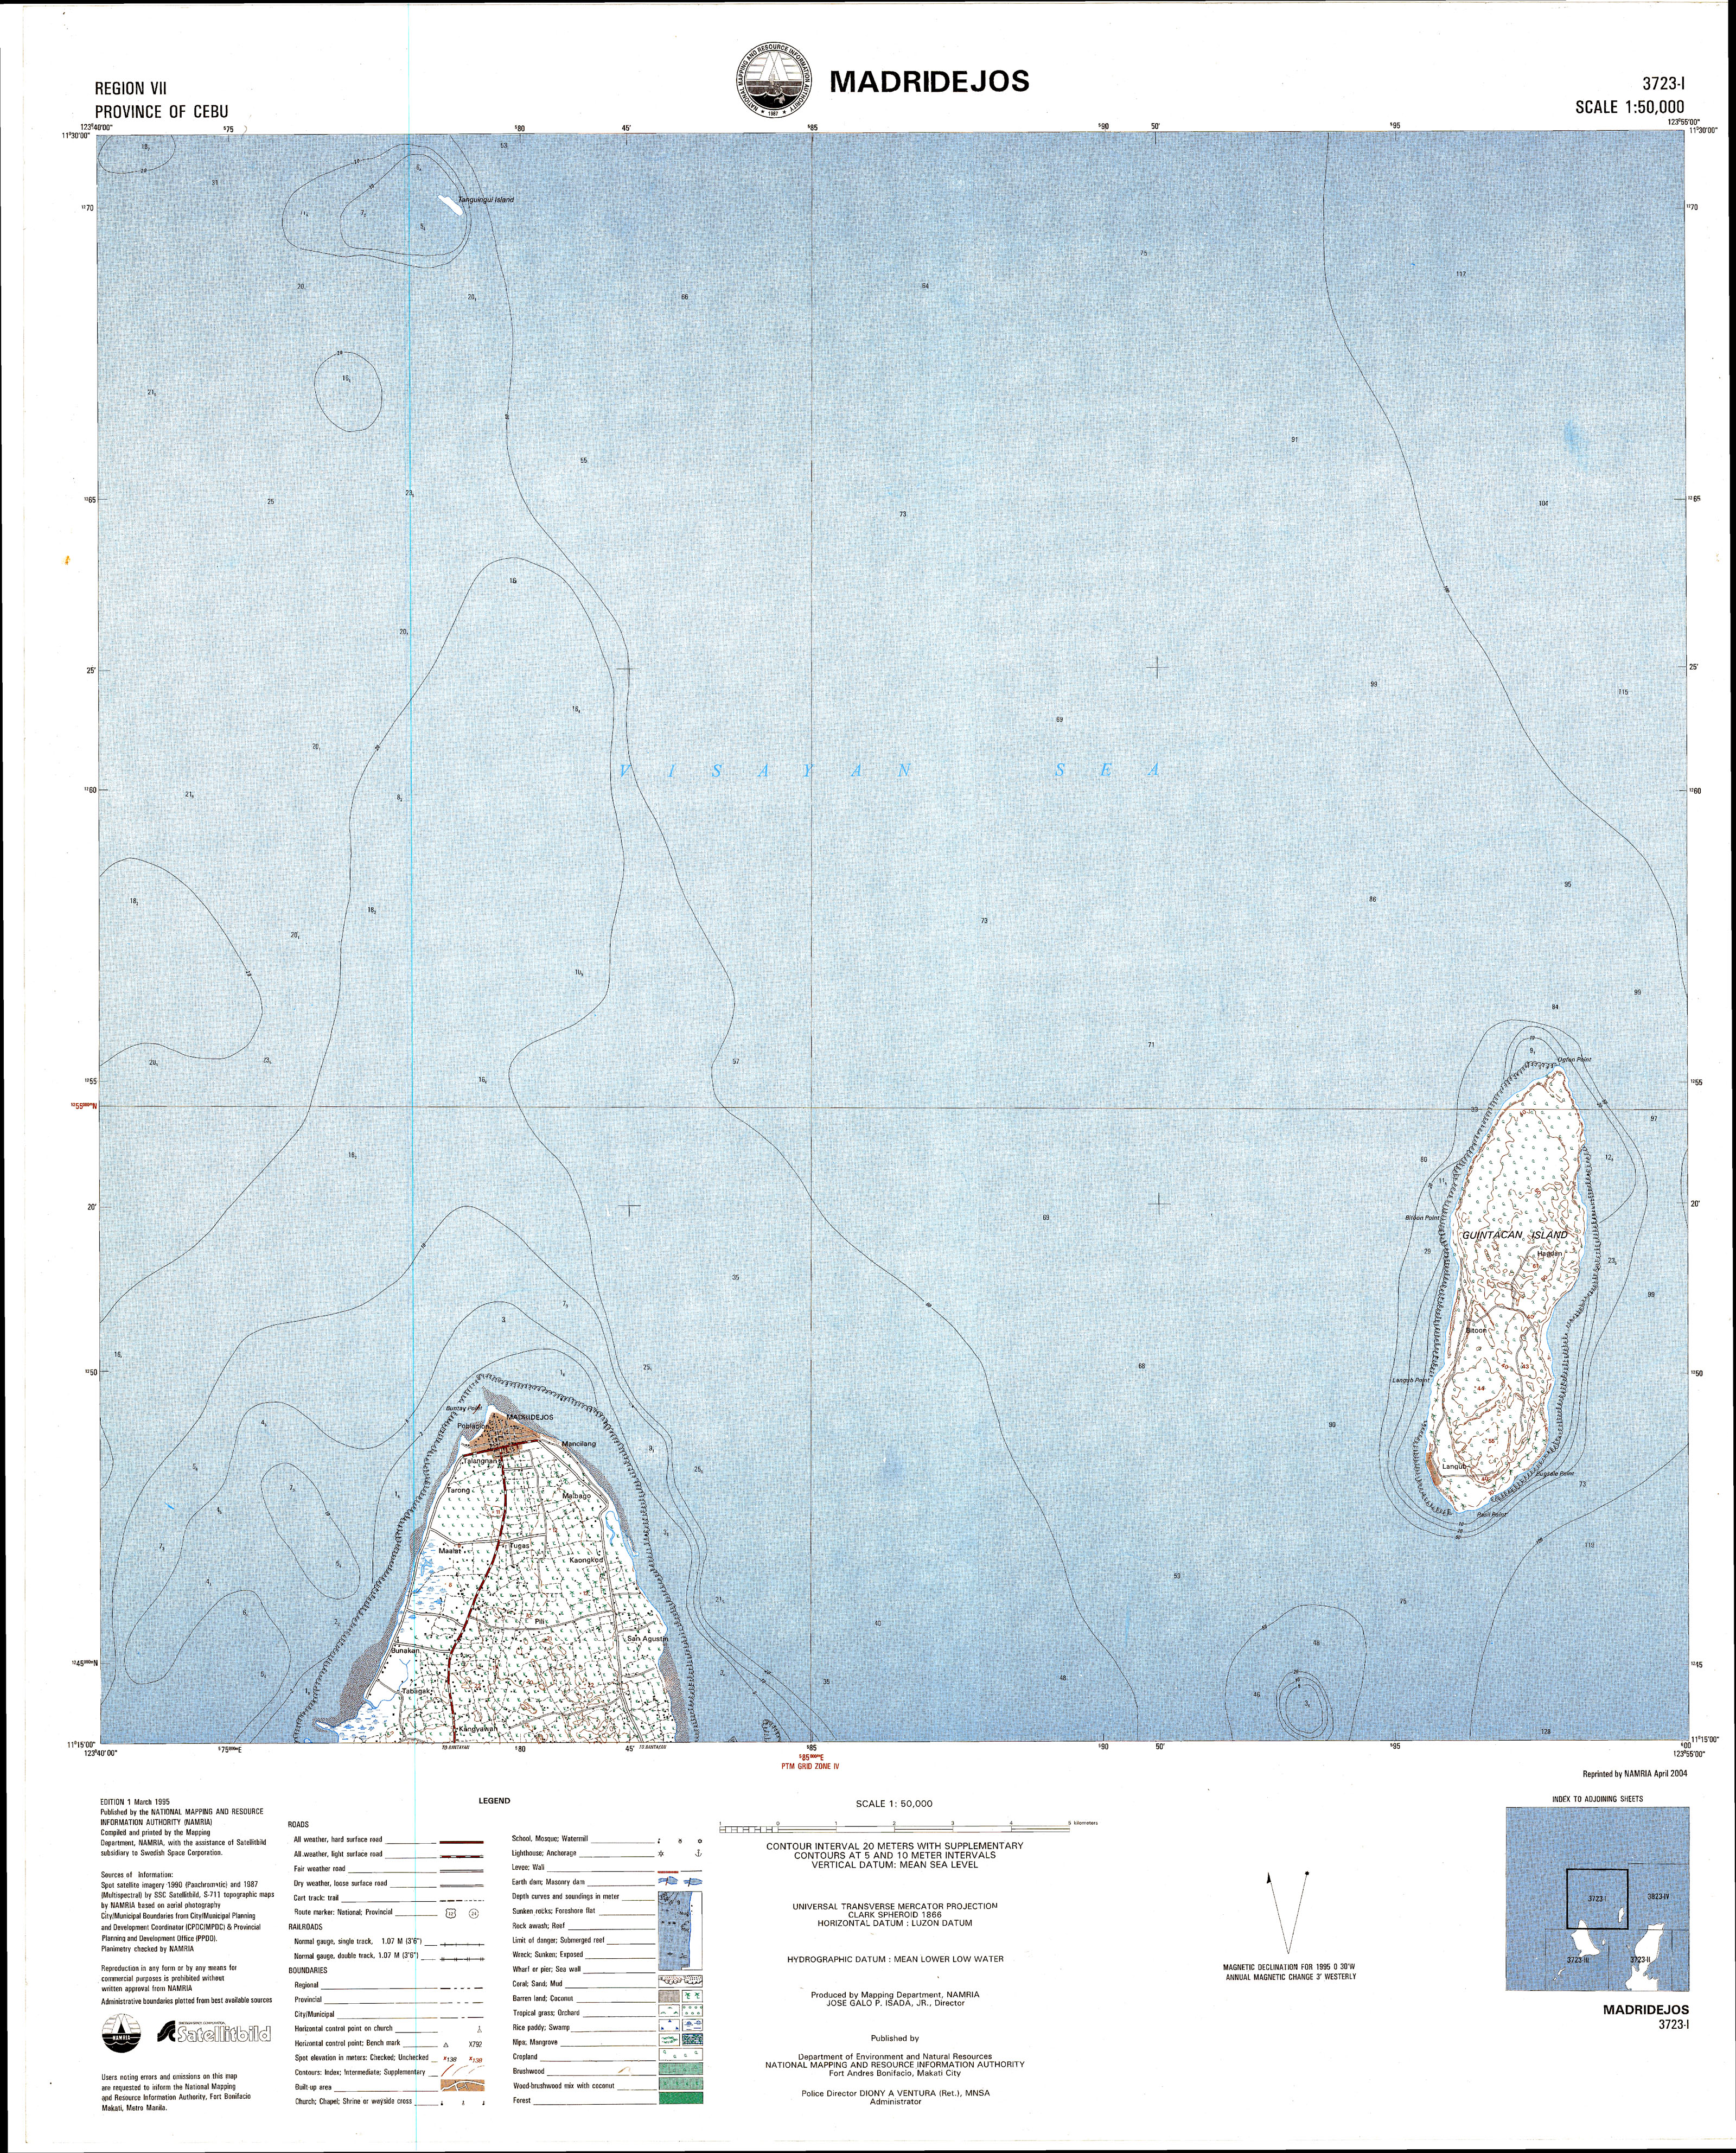
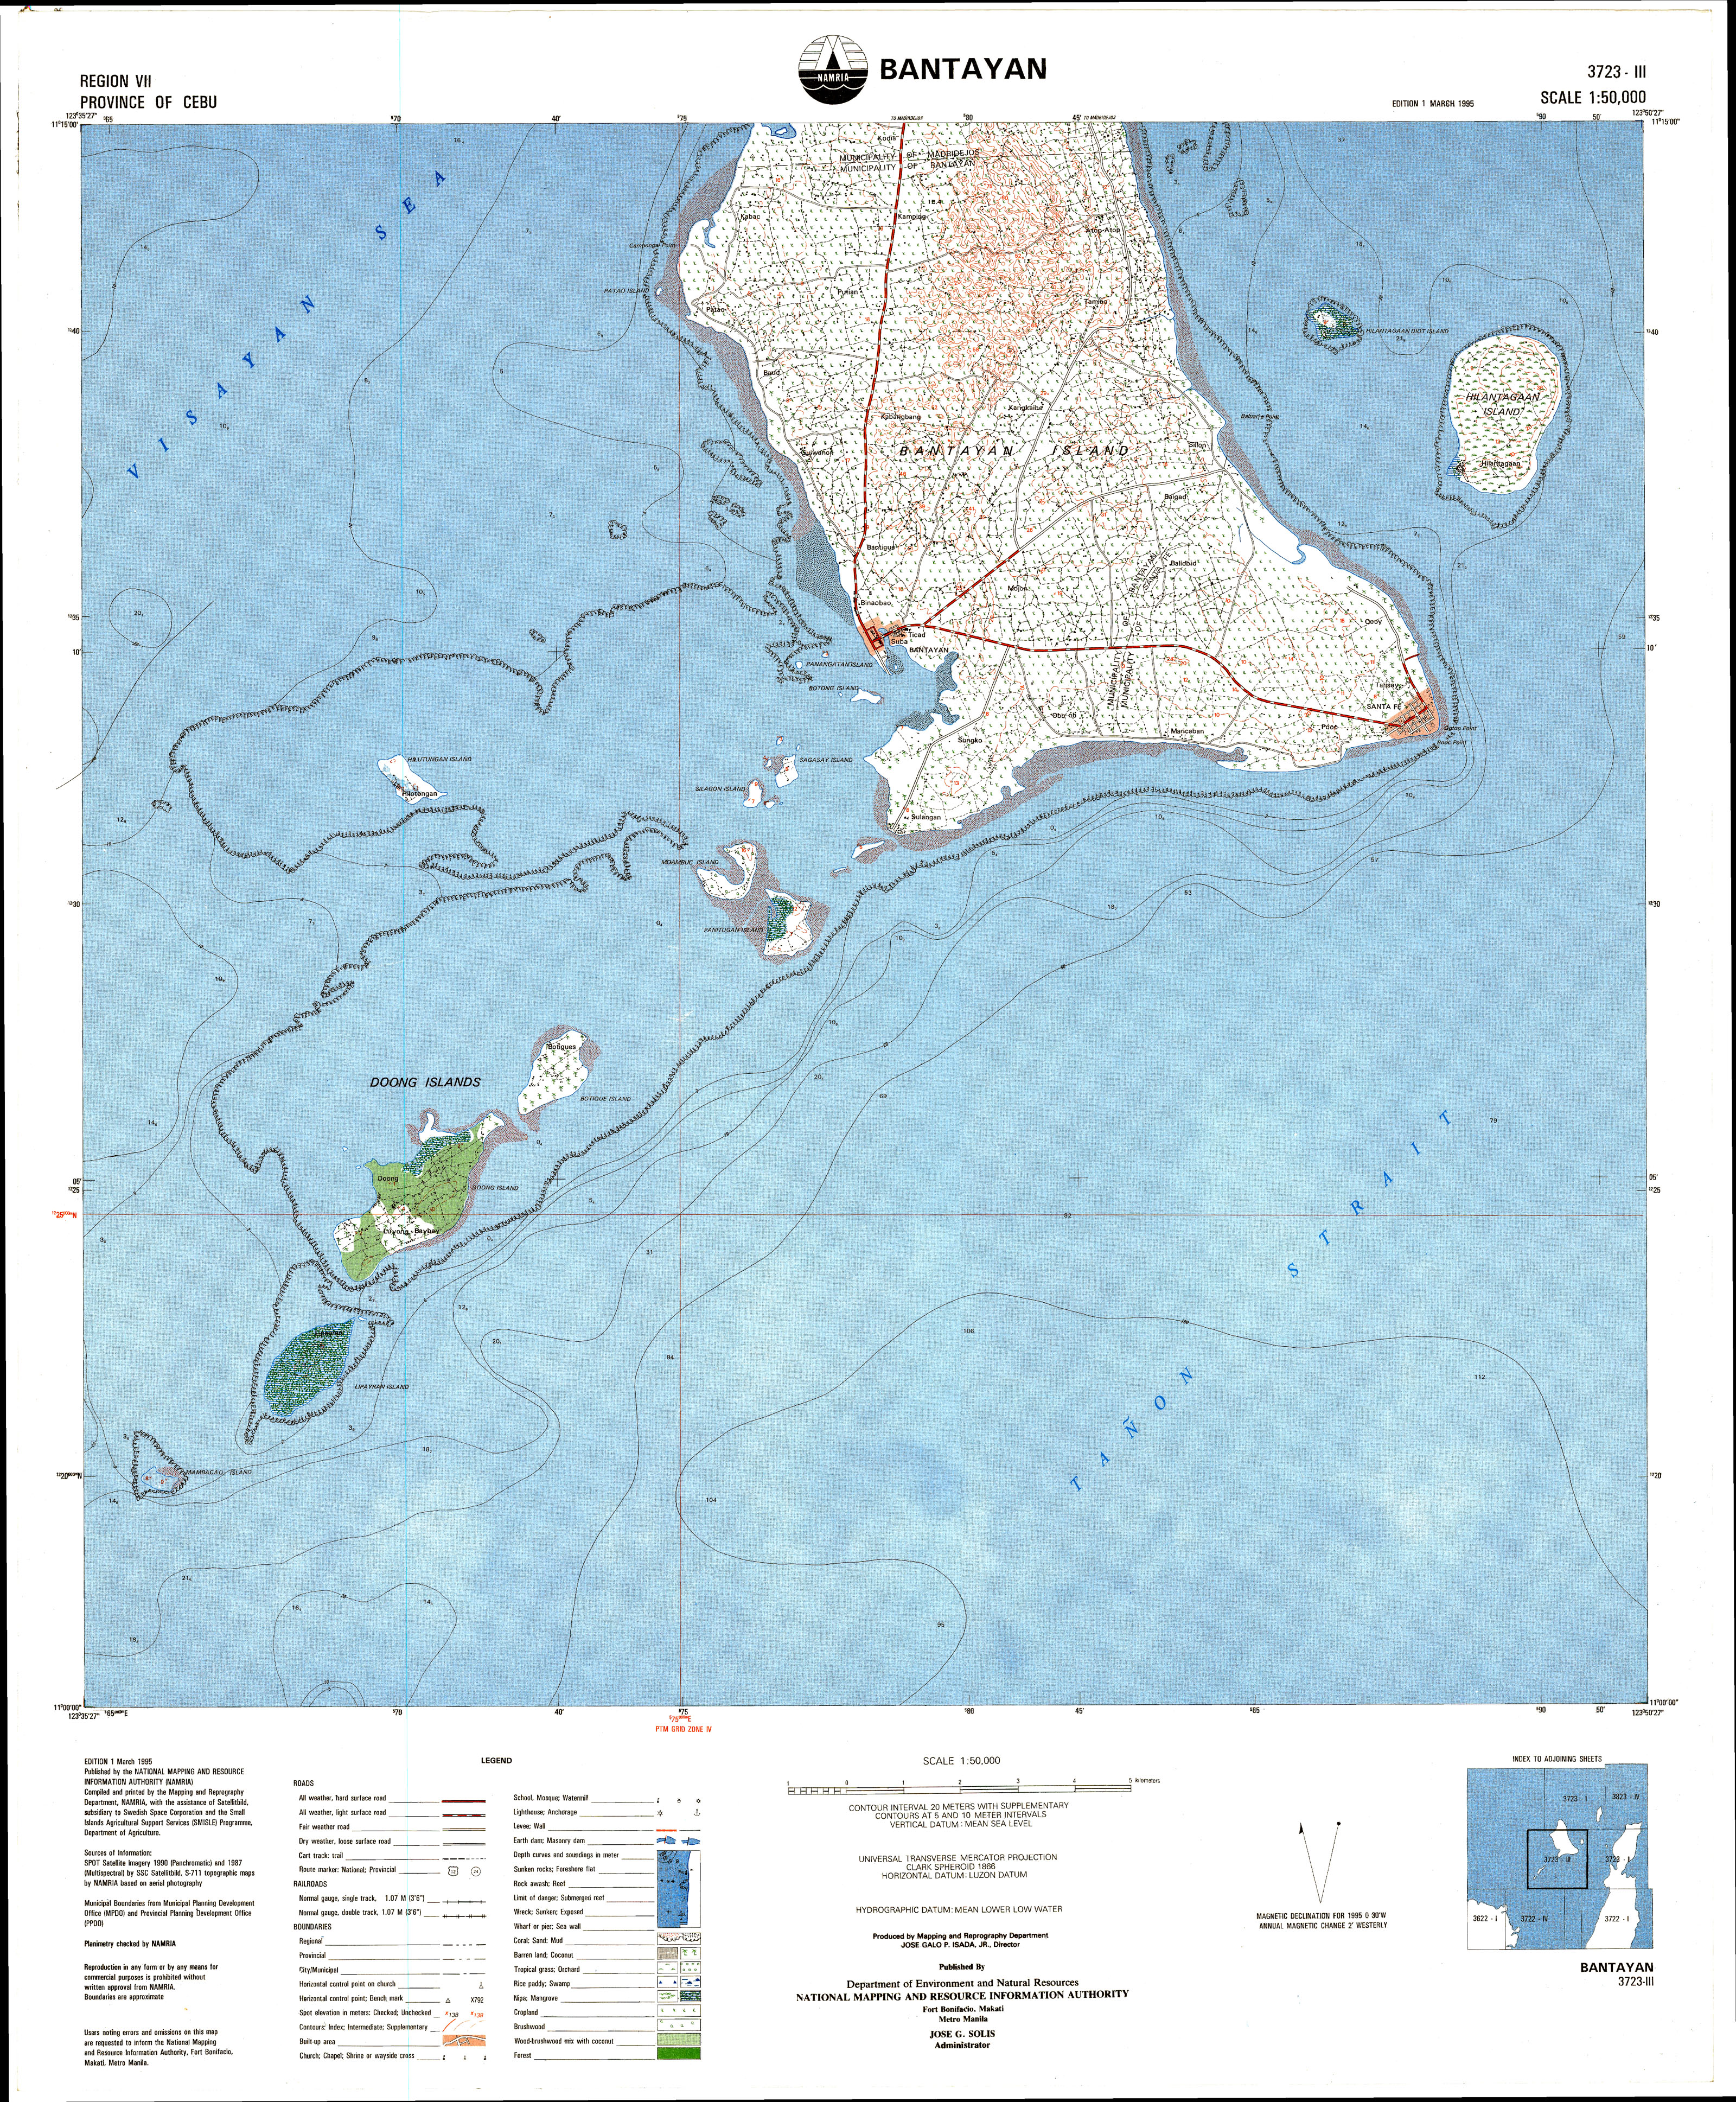
Island group
Bantayan is the main and largest island of the Bantayan island group that lies close to the geographical centre of the Philippine Islands archipelago.
The island group includes numerous smaller islands (some uninhabited / uninhabitable), mostly around the southwest corner of the island. About 20 of these islets stretch for about 8 kilometres (5 miles) southwest from Bantayan municipality port area, with some nearer ones being accessible on foot from the main island at low tide. The islands are beside the busy shipping lanes for ships and ferries coming from Mindanao or Cebu City on their way to Manila. The islands are all small and green and low, virtually indistinguishable one from another.
Some of the more notable are:[a]
| 1 | Botique (or Botigues, Batquis)[b] | ||
| 2704 | 100 ha | 2,700/km2 (7,000/sq mi) | |
| 2 | Botong[c] | ||
| 3 | Byagayag Islands (Daku & Diot)[d] | ||
| 4 | Doong[e] | ||
| 2318 | |||
| 5 | Hilantagaan (or Jicantangan, Jilantagaan, Cabalauan) | ||
| 6 | Hilantagaan Diot (or Silion, Pulo Diyot, Virgin island) | ||
| 7 | Hilutungan (or Hilotongan, Lutungan)[f][g] | ||
| 2060 | |||
| 8 | Lipayran[h] | ||
| 3067 | 150 ha | 2,000/km2 (5,200/sq mi) | |
| 9 | Mambacayao (or Mambacayao Daku)[h] | ||
| 10 | Moambuc (or Maamboc, Moamboc, Kangka Abong, Cangcabong)[d] | ||
| 11 | Panangatan (or Pintagan) | ||
| 12 | Panitugan (or Banitugan) | ||
| 13 | Patao (or Polopolo)[i] | ||
| 14 | Sagasay (or Sagasa, Tagasa)[d] | ||
| 15 | Silagon[d] | ||
| 16 | Yao Islet (or Mambacayao Diot)[h] | ||
- 'These Bantayan islets are numerous, and are all low and very small.' —Juan de Medina (1630)
-
 5 Hilantagaan Island seen from the Santa Fe–Hagnaya ferry (S)
 -
 6 Hilantagaan Dyot, brgy Hilantagaan, Santa Fe, seen from W.
 -
 7 Sunset over Hilutungan, seen from E.
 -
 13 Patao island (or Polopolo) off Patao, Bantayan


In addition, Guintacan Island (or Kinatarkan, Batbatan) to the NE is part of Santa Fe municipality although it is not part of the Bantayan islands group.
- ^ Islands have several names, according to speaker's language. First name shown is as it appears on the NAMRIA topographical map.[4] Some of the smallest islands are not named on map.
- ^ Municipality: 072209005 Botigues
- ^ Municipality: 072209021 Sungko
- ^ a b c d Municipality: 072209023 Sulangan
- ^ Municipality: 072209007 Doong
- ^ Declared a "Tourist Zone and Marine Reserve under the administration and control of the Philippine Tourism Authority" by Presidential Proclamation 1801 of 1978
- ^ Municipality: 072209008 Hilotongan
- ^ a b c Municipality: 072209013 Lipayran Cite error: The named reference "Lipayran" was defined multiple times with different content (see the help page).
- ^ Municipality: 072209018 Patao
- ^ Censuses of Population (1903–2007). Table 1. Population Enumerated in Various Censuses by Region: 1903 to 2007. National Statistics Office.
- ^ Census of Population and Housing (2010). Population and Annual Growth Rates for The Philippines and Its Regions, Provinces, and Highly Urbanized Cities (PDF). National Statistics Office. Retrieved 29 June 2016.
- ^ Saz 2007.
- ^ [Topographic Index Map 1:50,000 NTMS (National Topographic Map Series)] (Digitised map) (Map) (1 ed.). 1:50,000. Cartography by SPOT satellite imagery 1990 (Panchromatic) & 1987 (Multispectral) by SSC Satellitbild / S‑117 topographic maps by NAMRIA based on aerial photography. Fort Bonifacio, Manila: National Planning and Resource Information Authority. March 1995. § 3723‑I Madridejos and 3723‑III Bantayan. Retrieved 24 February 2013.
{{cite map}}: Check|url=value (help); External link in|publisher=and|section=